Project plans can be detailed and complicated but project presentations should not be. Communications to clients, executives and other key stakeholders should be clear and easy to understand, and not complicated.
Although customers and execs expect high level status reports, a common presentation mistake is using project management software to generate charts which are laboriously fit and pasted onto a PowerPoint slide. Presenting this kind of chart in a project review will lose your audience’s attention and the message of your presentation will get ignored.
Project management software is designed to manage the end-to-end complexity of project work, not to create visuals for project reviews. This kind of software produces complicated project charts which are intended for use by the project team. They are complex images which are difficult to read in a presentation environment and they are too detailed for exec level presentations.
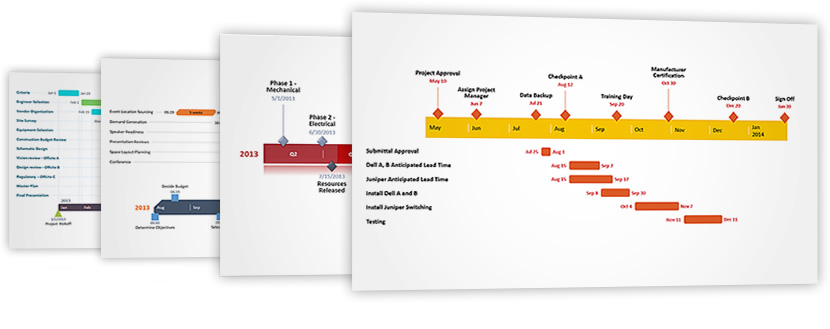
Gantt chart software is designed to create visuals that are appropriate for presentations to clients, executives and key stakeholders. For important meetings you will want to use a Gantt chart maker that is natively integrated into PowerPoint. Doing so, not only leverages the familiar PowerPoint platform, but it also creates very graphical charts that are easy to understand and easy update as project schedules change. Most importantly Gantt chart software that is integrated into PowerPoint natively renders impressive project visuals in the format that customers and execs expect from you – PowerPoint.
Source : Office Timeline